Formatting the visual styling of charts can be… tedious. When a presentation has a number of charts, all needing the same visual styling, saving a chart template can be a huge time saver!
- Format a chart with all of the visual styling. Here is the sample stylized chart for this tutorial.
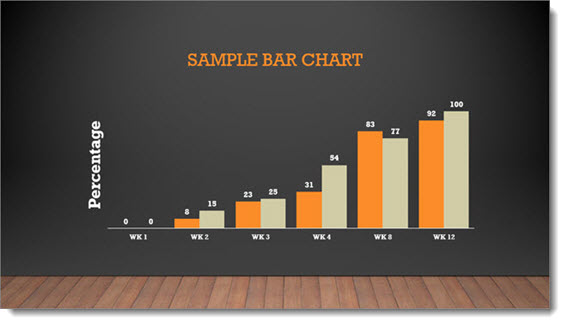
-
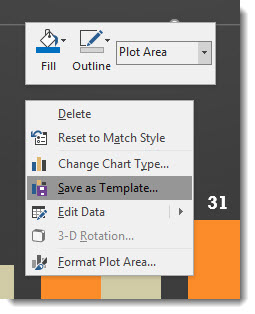
Right click the chart and select SAVE AS TEMPLATE
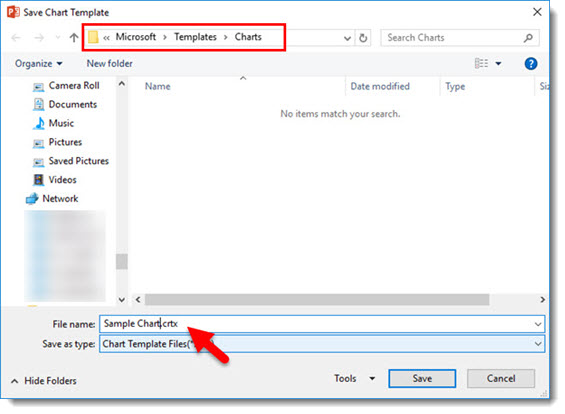
- In the SAVE CHART TEMPLATE dialog, give the chart template a (short) name that helps identify the styling (ie. project name, type of chart, colors used, etc.). The Chart Template is automatically saved into the Microsoft/Templates/Charts folder (and must be in this folder for PowerPoint to use it).
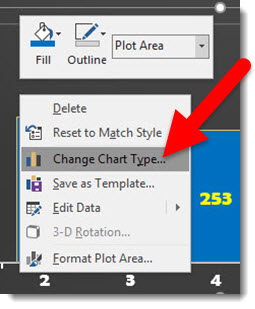
- To apply the chart template styling to a chart, select a chart, right click and select CHANGE CHART TYPE
- In the Charts dialog, select TEMPLATES and the custom template to apply
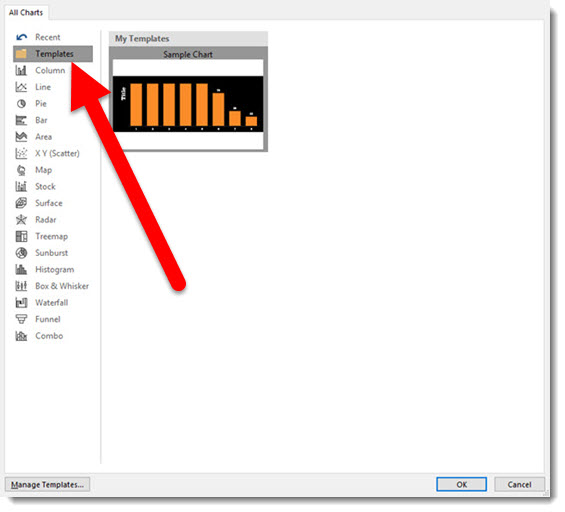
- Click OK and done!
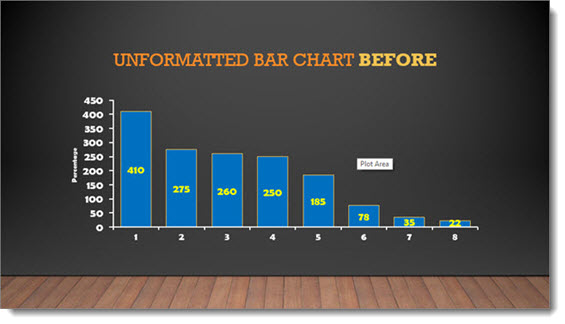
Here is an unformatted chart.
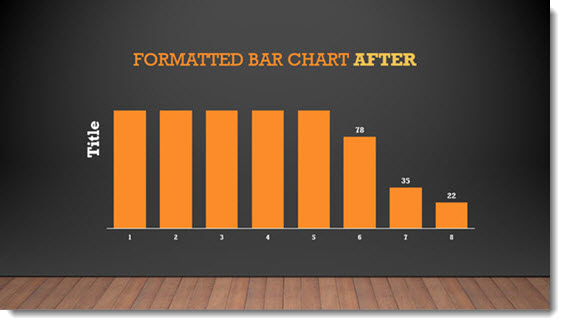
And here is the same chart with the above chart template (4 clicks and formatted!).
NOTES:
- Chart Templates are local to a computer, they DO NOT travel with a presentation.
- Chart Template thumbnails are very limited in the visual and description, so if you have many it can be difficult to tell them apart.
- Right-click to Save Template was introduced with an Office365 PowerPoint 2016 update, I have not tested in previous versions.
Troy @ TLC