There is a good reason for this feature, but for most it seems to be bug. Which is it, depends on your preference.
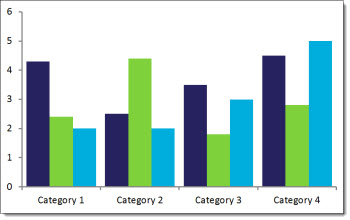
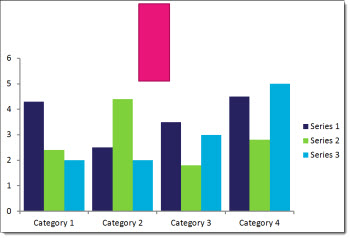
Here is the scenario. A chart is on a slide:
With the chart selected, you decide to add a callout box to highlight the important data in the chart.
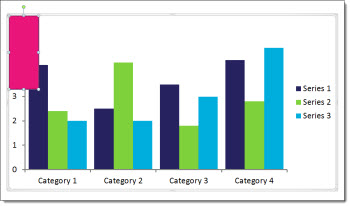
The new shape is inserted, editable and look like what you wanted. But the shape is actually within the chart boundaries. In this case you select the new shape, and the chart is also still. Select the chart, and the shape is also part of the selection.
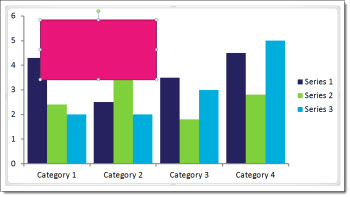
The dilemma is the new callout shape can be edited and moved – but it can only move within the chart boundaries. It is also connected to the chart for animation.
What PowerPoint has done, which is actually by design, is inserted the shape as part of the chart element, because the chart was selected while the shape was inserted. If the chart is moved, the shape moves. If the chart is deleted, the shape is deleted. But the shape does not directly interact with the chart. As example the chart styling options do not change the shape styling. Chart animations do not animate the new shape(but animations can be added and controlled for the shape, they are part of the chart element animation).
For some, this is a feature – the ability to tie new shapes to a chart. For others, it is a bug – they did not want the shape tied to the chart.
SOLUTION: If you want the shape outside of the chart, the easiest fix is to select the shape (select the chart, then select the shape within the chart) >> copy >> delete >> unselect the chart >> paste. Now the slide has a chart element and a separate shape element.
– Troy @ TLC