Monthly Archives: July 2010

A stack-O-Computers For The Show

Here was my morning activity for a recent show. Bring out the multiple show computers (all running PPT 2010), connect, test output and work. Powerful laptops are big, but I wouldn’t try carrying a stack of desktop computers!

– Troy @ TLC

By |2016-08-16T11:21:43-07:00July 11th, 2010|Personal|

Sample Slide – U.S. Population Growth

I needed a slide that showed the 5 states with the most population growth over the past 5 years. The original slide had a standard bar chart, which told the statistics but was not very compelling.

I recreated this slide with a map of the U.S. highlighting the top 5 states. I used the 3D tools in PowerPoint to make the states ‘pop’ out of the map and applied a custom gradient fill to each. I also applied a 3D rotation to the state name and percentage text with a white glow to allow the text to be easy to read.

Note: all data in these slides is sample data (eg. I made it up, while I waiting for real data from the client).

– Troy @ TLC

By |2016-08-16T11:22:15-07:00July 9th, 2010|Portfolio|

Perception Slide

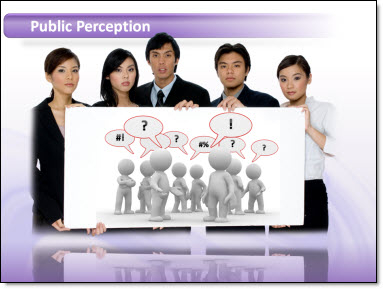
From a project, this slide was about how co-workers perceive the actions of different departments within their own orgranization. The title was shortened to a simple statement of “Public Perception”. The 4 wordy bullets of text eliminated and replaced with a single image that the presenter was able to talk to and use to set the stage for a quick story and explanation of the point being made.

The image was developed from a few Royalty Free images (from Thinkstock.com) that I modified in Photoshop before adding to the slide.
1. Group image holding blank white sign that I dropped out the background from and saved as a .png with transparency (note the middle guys head is able to overlap the title bar)

2. 3D rendering image of a generic group of characters (in this case representing the ‘other’ departments).

3. The speech bubbles and talking symbols where added in PowerPoint. The speech bubbles an imported .emf I created in Illustrator and the text as stylized PPT text.

4. The reflection is from PPT

– Troy @ TLC

By |2016-08-16T11:22:37-07:00July 7th, 2010|Portfolio|

3D vs Flat .JPG Sample

I had a series of slides with a dominant visual of reports, articles and other “Flat” content. Here is a sample showing the inserted .jpg of the Sustainability Report.

Rather than leave the slide with just an inserted graphic I used the 3D Rotation in PPT to add some perspective and a more dynamic slide layout.

I then used the eye dropper tool to pickup the 3D attributes and apply the same effect to each the image on each slide.

– Troy @ TLC

By |2016-08-16T11:22:58-07:00July 5th, 2010|Portfolio|
Go to Top