Can PowerPoint Use the Newer H.265 video format?
Here is a question for all presentation designers: Can PowerPoint use the newer H.265 video format?
The answer is YES! PowerPoint does recognize the H.265 video format… but there are some gotchas to be aware of at this time.
We successfully tested embedding and playing an H.265 video in PowerPoint. On top of that, we tested playback on all PowerPoint platform options, with verified success across these four:
- Windows desktop PowerPoint
- Mac desktop PowerPoint
- PowerPoint for Web
- Teams PowerPoint
Overall, this is good news for presentation designers, because H.265 offers more efficient compression than the more common (and older!) H.264 video format. It’s only a one-number difference in the name, but there are a LOT of great improvements in that single number change!
In the simplest terms, H.265 videos mean we keep the same video quality and resolution, while having a much smaller video file.
WHAT IS H.265?
H.265, also known as HEVC, is just a newer video codec. H.264 has been the industry standard for almost 2 decades, so it is about time for something new and better!
Let’s step back and talk about video file formats vs video codec format. In simple terms, the video file you get is either an .MP4 or .MOV. Those are the video file FORMATS. Now, HOW the video is created is what the codec is. So, an .MP4 can be created with an H.264 codec or an H.265 codec (or several other options).
Further, the video codec is the process used to compress a video when the file is created, and then uncompress (or DECode) it dynamically for playback. This matters because video files need compression to be practical (eg. keeping a small file size).
The better the compression, the smaller the file size. The better the uncompress process during playback, the smoother performance and higher image quality can be during playback. A more efficient codec makes it possible to compress a video much more, without any visible quality loss.
That is the appeal of H.265: it’s just a more efficient codec. It delivers the same visual quality as the current H.264, but with better compression efficiency.
H.264 VS. H.265
For most presentation designers, the comparison is straightforward. A smaller video file size, at the same quality, is a win.
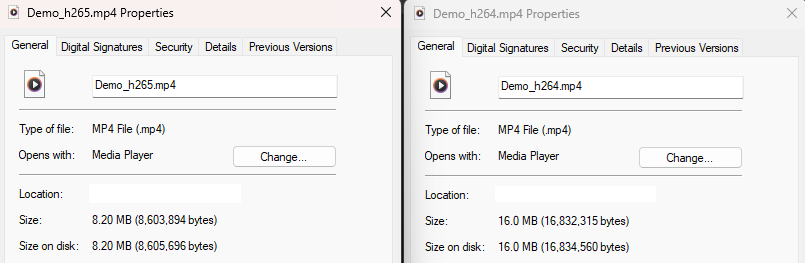
Here is an example. We took the same video and rendered one version as H.264 and another as H.265. Both videos use the same resolution, bit rate, and audio quality. Here are the results; the H.265 version is 8.2 MB. The H.264 version is almost twice as large at 16.0 MB. Using videos that are 45% smaller in file size is better for PowerPoint presentations!
PowerPoint Considerations
Not everything is perfect just yet. Moving to H.265 videos can be done – and TLC Creative is actively using videos in this format for presentation projects. But PowerPoint as a whole is still an H.264 workflow.
- Using PowerPoint’s built-in video optimization, videos will be converted to H.264, and (this is important) even the shiny new H.265 videos.
- Exporting slides to video creates H.264 format videos. There is no option for PowerPoint to create videos using the improved H.265 yet.
In other words, H.265 is not just a technical format update; it can be a real workflow improvement for PowerPoint users using video in presentations. Just beware using PowerPoint’s built-in video optimization!!
Skyler @ TLC Creative Services
Can Morph Be Used with Videos?
We recently created a slide, using a cropped image and the Morph transition to shift the visible portion of the image between slides. I have to say, Morph has given PowerPoint a smooth, clean, cinematic visual pan effect!
Here is how we set this up using our static image (which we pulled from our video):
Slide 1 = Add image, size, position, and crop (the effect relies on there being more of the image being non-visible)
Slide 2 = Select the image, move the cropped area (in this example, sliding the image to the left), and set the slide transition to Morph.
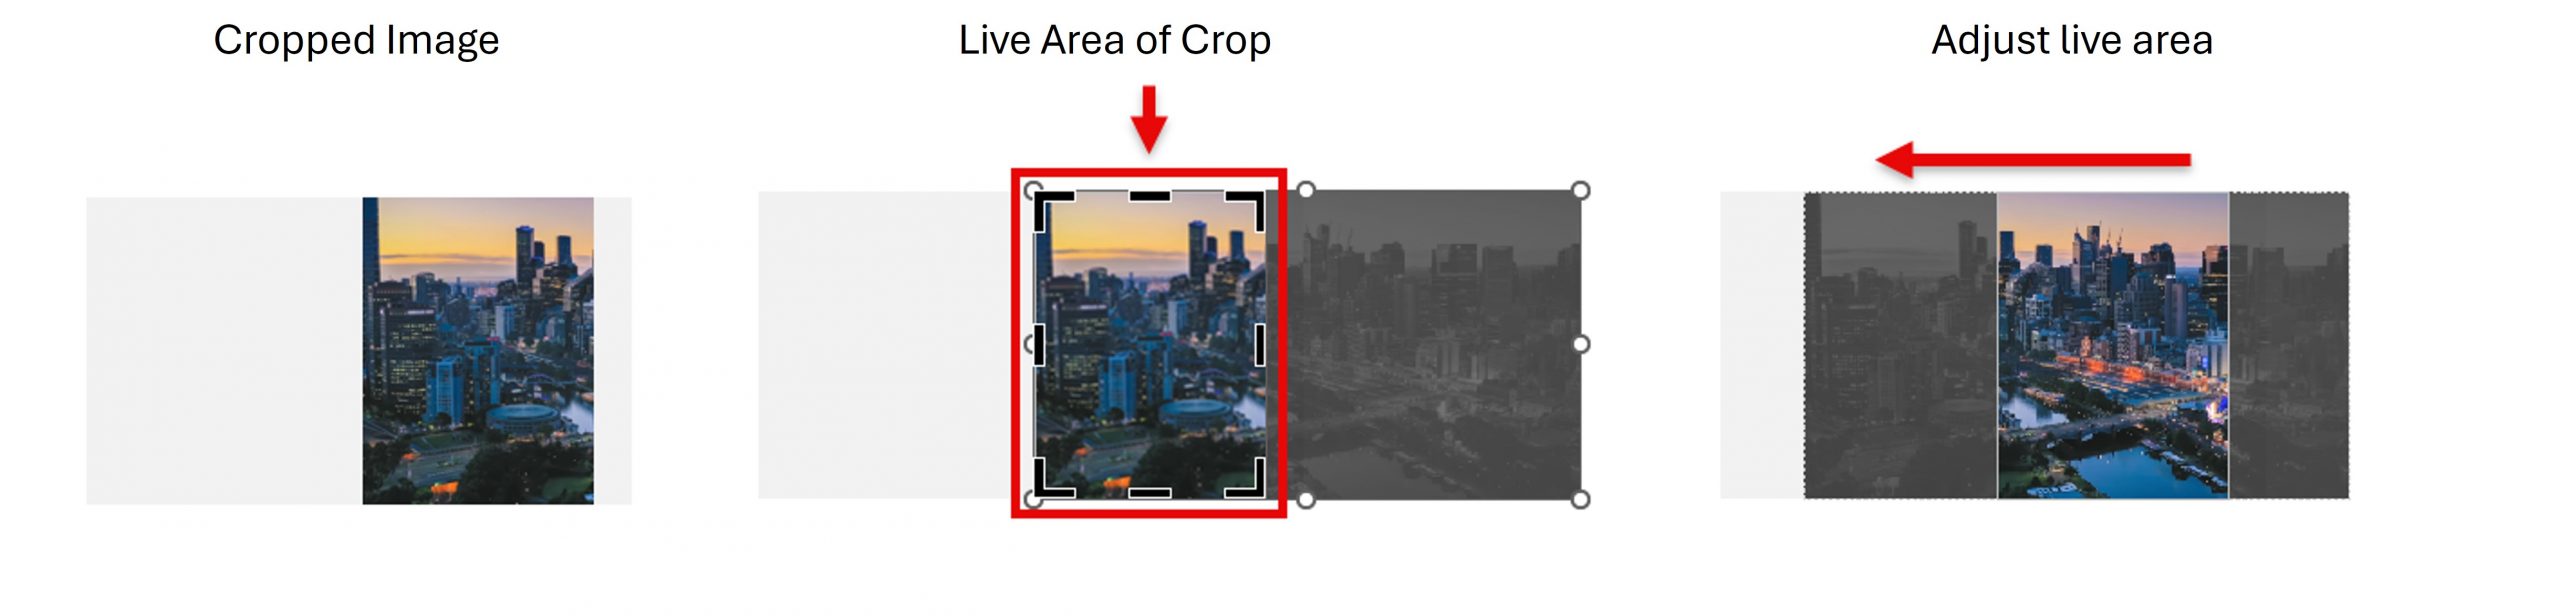
Slide 3 = And for this example, there was a 3rd view of the image. Select the image, move the visible cropped area back (sliding it to the right).
But, trying to replicate the same effect with a video, using the identical morph setup? Well, that does not work so well…
Unfortunately, this showcases a limitation within PowerPoint. Videos cannot play across slide transitions. And in the case of a Morph transition, the video playback pauses when the transition starts, and there is no Morph movement. PowerPoint falls back to a Fade transition and resumes video playback by jumping ahead to where the video is on the timeline.
If anyone at Microsoft is listening, we, the end users, really, really need videos to be able to play across slides for so many presentation needs!
Troy @ TLC Creative
App Inconsistencies – This Time Adobe Premiere and Audition
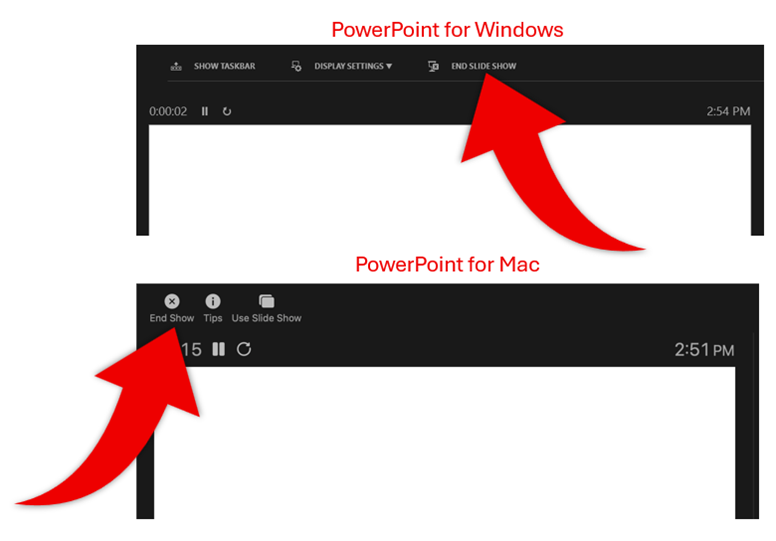
Recently I have been in several conversations about inconsistencies across PowerPoint on different end points (as example, in Presenter View, why is the “End Show” button at the top in a different order on Windows, Mac and Teams!).
Because inconsistency is something I am thinking about, I caught another inconsistency that encounter daily, but have ignored – for years. While working on a multimedia project this past week, this time I the inconsistency between Adobe Audition and Adobe Premiere registered. Granted, this is a small thing, but in thinking of the design work, this has been a mental pause and break in workflow every time I am moving between these two apps.
Both Audition and Premiere work with layers. And the layer height, for visibility, is adjustable. But why is how you adjust the layers different between the programs!?
With Adobe Audition, to make a layer taller, the adjustment is by dragging the BOTTOM of the layer.
With Adobe Premiere, to make a layer taller, the adjustment is by dragging the TOP of the layer.
No action items or hacks from me, just documenting my design life thoughts – and why companies with many apps do not look at things wholistic and see inconsistencies that their users have to deal with…
Troy @ TLC
Nashville, Vectors, and Paper Puzzles: Nolan Haims Prepares for CreativePro Week
New episode of The Presentation Podcast now available!
As the world of graphic design continues to expand, the boundaries between traditional design disciplines and presentation design are blurring. And CreativePro Week, a premier design conference brings together designers, creatives, and presentation experts.
In this episode, Troy has a behind-the-scenes conversation with Nolan Haims, hearing about his upcoming CreativePro Week talks, the process, and his expectations for the event. They also talk about the growing importance of presentation design, and actionable strategies for leveraging PowerPoint as a true design tool. Listen on your favorite podcast app, or at The Presentation Podcast site here.
Power Tips for PowerPoint’s Playback Media Bar
If you are reading this post, I hope you’ve already read the previous post, “What is the PowerPoint Media Bar?”!
At TLC Creative Services, we leverage PowerPoint’s embedded media capabilities for many projects. So with that experience in mind, we have several audio/video tips and tricks for you! Here are a few of our favorite power user tips for PowerPoint’s playback media bar:

1. Volume
a. PowerPoint sets the volume at 80% when inserting videos or audio files. Click the speaker icon to adjust the preset volume (eg., make it quieter for videos that will be spoken over, make it louder for the presentation intro!) – or mute the volume if no audio is needed for that video. Save the presentation, and the volume setting will also be saved.
2. Presenter View
a. The slide preview is active for the playback media bar. Move the mouse over the Presenter View slide and video, and the playback media bar displays and becomes interactive (eg., you can pause, play, scrub, etc.).
b. BEWARE, the playback media bar also (unfortunately) is seen by the audience too! They just don’t see your mouse!

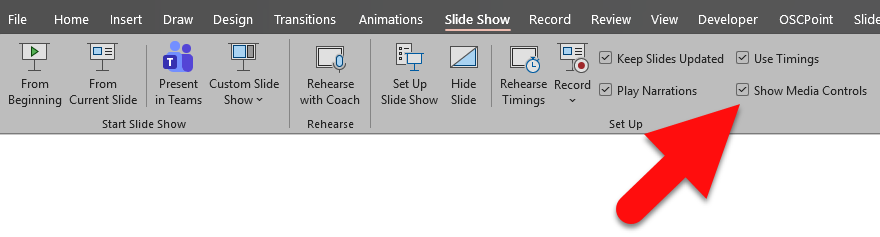
3. Turn Off the Media Bar
If you don’t want to have the media bar popup while presenting, PowerPoint has an option to turn off the media bar!
a. Go to the SLIDESHOW tab
b. In the SETUP section
c. Uncheck the SHOW MEDIA CONTROLS
NOTE: This (unfortunately) affects all media in the presentation, and cannot be set to only disable the playback media bar for specific videos ☹️
Troy @ TLC Creative Services
What is the PowerPoint Media Bar?
After a conversation with a PowerPoint user, I was looking at this past blog post from March 2016, Use The PowerPoint Video Playback Bar. While all of the info there is still accurate, it’s time for a refresher and a few updated tips!
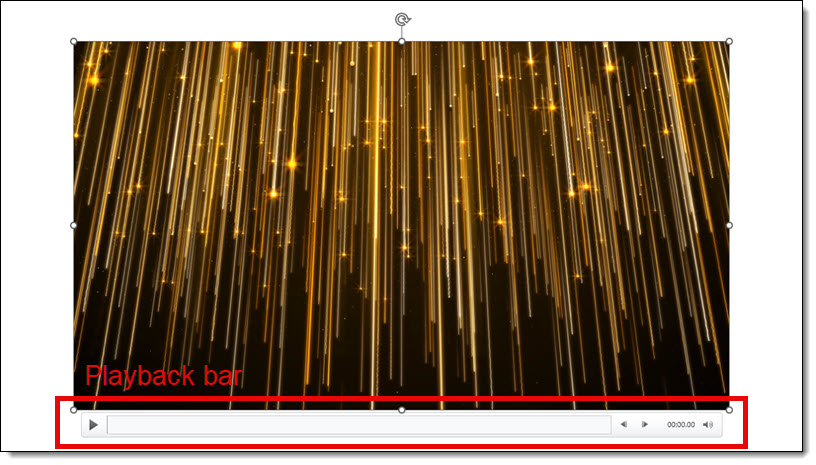
Every video and audio file embedded on a slide has a pop-up media playback bar seen while editing the slide, and when presenting.

Where the media bar displays depends on where it is viewed; either slide edit view or presenting. When editing a slide, clicking on the video (or audio speaker icon) displays the playback media bar BELOW the video. In this view, the media playback bar is opaque (covering any slide content under it).
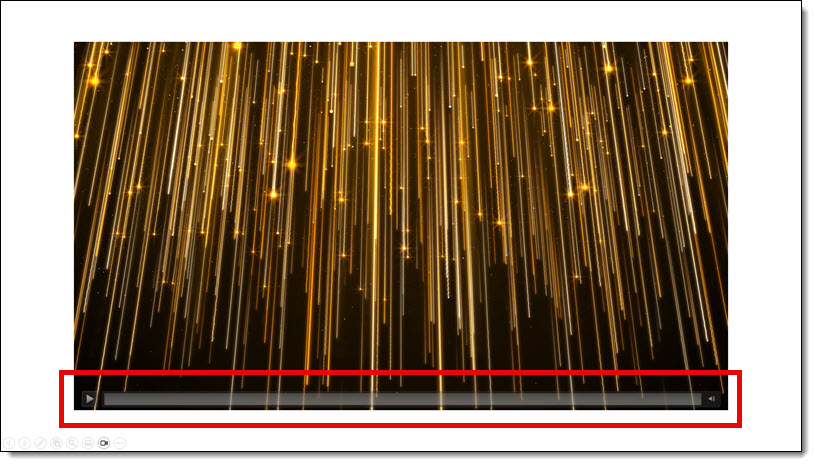
When presenting and moving the mouse over the video, the playback media bar displays OVER the bottom of the video. In this view, the media playback bar is semitransparent, allowing the video under it to still be seen.
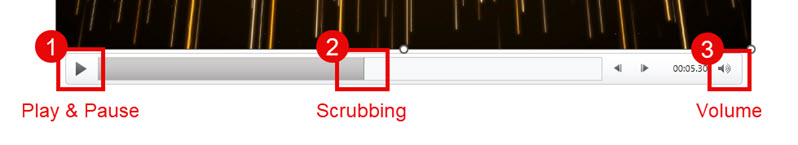
The playback media bar has 3 playback control options:
1. Play / Pause the video (or audio)
2. See the playback progress, plus click anywhere on the timeline to jump to that position, or click-and-drag to “scrub” through the video forward or back
3. Volume Control
One of the really exciting updates to PowerPoint since the 2016 blog post is that we can interact with media in Presenter View, without the audience seeing our mouse onscreen! As example, this animated GIF shows a sample presentation’s Presenter View. Moving the mouse over the video, on the Presenter View screen – not the audience slide screen, the media playback bar displays and the presenter can interact with it in any way needed (NOTE: while the mouse is not seen by the audience, the media bar is seen on the slideshow – which is a disappointment to me).
Check back for the next post, where I am covering some “Power Tips for PowerPoint’s Playback Media Bar”!
Troy @ TLC Creative Services
Make a Video Arrow
This short tutorial walks through the design process our presentation design team uses to create these fun “video arrows” in PowerPoint. The end result will be a series of arrow shapes on a slide… but their background is a dynamic video!
To start, add 3 PowerPoint arrows to a fresh slide (these can be the default PowerPoint arrows, or a more stylized .svg arrow from PowerPoint’s Stock Images, or a resource like TheNounProject. For this example, we used 3 ascending PowerPoint arrows:
![]()
With the static arrow layout set, we can move on to create the video version. Find a video that is larger than the area the 3 arrows occupy.
- For the best visual effect, a seamlessly looping video is best.
- PowerPoint has a good selection of videos by going to INSERT > VIDEOS > STOCK VIDEOS.
- Or use your website of choice (our team used Adobe Stock for our video selection).
Embed the video onto a separate, new slide.
On the arrows slide, select the arrows and MERGE so they are a single shape:
1-3: Select all 3 arrows
4: Go to the “Shape Format” tab
5: Select “Union” from the Merge Shapes dropdown menu
![]()
This will combine the arrows into a single vector shape – this is a crucial step for the next part.
![]()
Next, copy the new single shape of 3 arrows and paste it onto the video slide.
TIP: Hide the original 3-arrow slide to keep it for later use, because in the next step, we are going to “destroy” the arrows, so they are no longer arrow shapes.
![]()
On your video slide, select the video FIRST. Then shift + click to select the arrow’s shape.
NOTE: The order of this selection is very important.
Go to the MERGE SHAPES again (select > Shape Format tab > Merge Shapes> Union). This time, select the INTERSECT tool.
![]()
This crops the video into the arrow shape! The result is a video that plays inside a custom video shape – all created in PowerPoint!! The standard PowerPoint video playback functions are still used to set the video to play and loop, AND you can use PowerPoint’s crop function to size and position the video within the arrow shape. Talk about cool presentation design!
![]()
Now, you can copy and paste these custom video shapes into any presentation!
Jake @ TLC Creative Services