SmartArt Balancing Act
SmartArt really makes you look – smart! But did you know the Balance graphic is smart enough to adjust itself…?
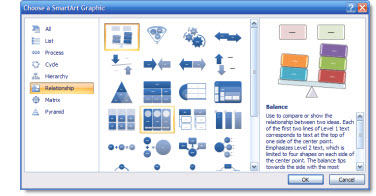
Go to INSERT >> SMARTART >> RELATIONSHIP >> BALANCE
Like all SmartArt the graphic is actually controlled by a standard bulleted list.
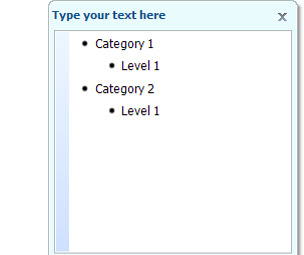
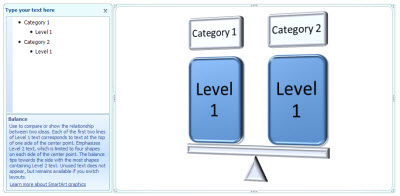
Here is my sample Balance SmartArt graphic. It has two categories, one for each side. And it starts off with equal balance – 1 bullet point per side.
But if you add more bullets to one side, the scale automatically ‘tips’ to the heavier side! Here I have added a second bullet to Category 1 and tipped the scale.
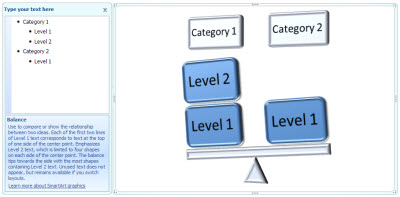
Note: only primary bullets affect the balance. Adding sub-bullets is fine, but they have no impact on which way the balance beam leans.
– Troy @ TLC