Welcome to November!
November, the 11th month of the year. We have almost made it to the end of another great year! TLC Creative Services has had a great year, which is evident by the diversity of projects we have worked on. For this month, starting Monday, the blog will be a collection of portfolio highlights and projects from this year.

Have a great weekend and see you Monday!
– Troy @ TLC
Happy Halloween 2012 (created in PPT 2010)!
[youtube src=”https://www.youtube.com/embed/RS7Zs_eIgzU?rel=0″]
Just a little Halloween fun here at TLC Creative Services!
– Troy @ TLC
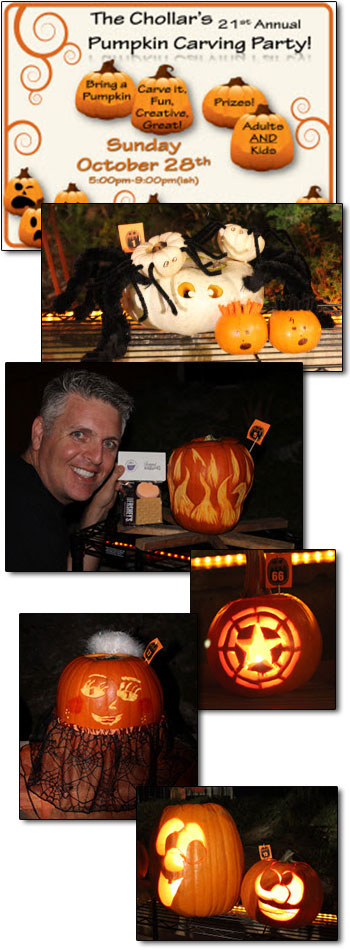
Pumpkins Everywhere!
We had a great group over to the house for our annual Pumpkin Carving party on Sunday! Lots of food, great conversations and a bit of competition… Over 40 pumpkins were judged in 5 categories. My family included Harry Potter-Ron-and spiders, a glowing camp fire with s’mores, The Avengers, a Ballerina and Larry & Bob from Veggie Tales.
Hope you have a great Halloween and start to fall!
– Troy @ TLC
QR Codes For Your Presentation
A “QR” Code is a “Quick Response” Code. Think of them as UPC, or SKU, codes on steroids.

The QR code is a great way to allow an audience to quickly capture your contact information, website, or your department’s page on the company intranet. And, using a QR code is free! Plus, virtually every online capable smartphone has free QR code reading applications. To use, just launch the app, take a picture of the QR code and it will automatically open a webpage.
At TLC Creative Services’ PowerPoint training programs, I open the session with a list of resources, one being a QR code to this blog. At the end of the training, my “Thank you” slide includes a QR code that goes to the TLCCreative.com contact page. Both are much quicker and easier than everyone scrambling for a pen to write down the info (and everyone has their phone out reading email, texting and probably checking the score of the game already).
There are many websites that let you create your own QR code for free. For this tutorial, I am using BeQRious.

What sets this site apart from many other free QR code generators is the numerous types of QR codes you can generate, but also the tracking and managing of your QR codes and data. Plus, generating a code is simple.
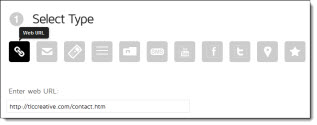
1. Select the type of code you want to generate: choose from web URL, email, phone, text, vCard, SMS, YouTube video, Facebook profile, Twitter profile, map, or graphical. Enter the information into the text box.
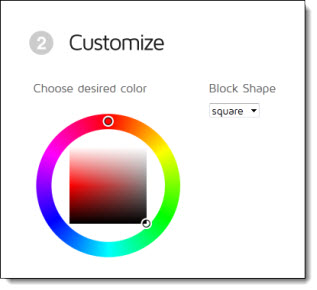
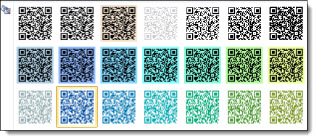
2. Customize the color of the code (QR codes do not need to be black and white, just high contrast).
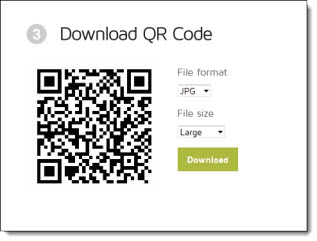
3. Download the QR code as a JPG, PNG, GIF, or PDF. And this site lets you choose how large you want your file size to be. The PDF option is great because you get your code as a fully scale-able vector image that can be made as large or small as you’d like, without losing any quality. At TLC Creative Services, we open the PDF in Adobe Illustrator and export as a .emf to have a vector (ie. scalable) graphic for PowerPoint. Or export as a .png is another good option for use on PowerPoint slides.
4. You can then insert your new QR code into your presentations to make it easy for your audience to connect with you.

5. Within PowerPoint (using 2007 and above), use the Picture Color feature to change the QR Code to any of the template colors. As long as there is contrast between the QR code and the background, it will work.
– Troy @ TLC
PowerPoint’s Image Reset Tool
How do you remove styling (drop shadow, bevel, shape, cropping, etc.) that has been applied to an image? – IMAGE REST.
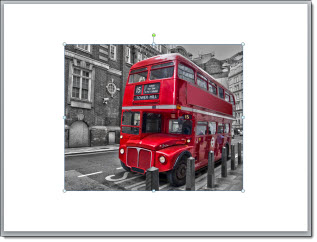
1. Insert image on slide.
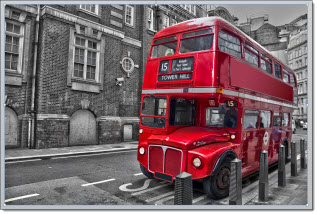
2. Resize image to fit slide, format and crop.
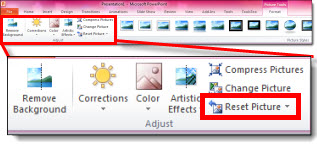
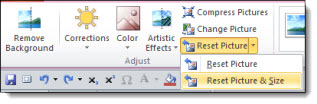
3. With the image selected, under the Format tab on the ribbon, there is the Reset Picture button with 2 options: Reset Picture or Reset Picture and Size.
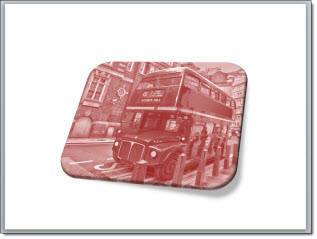
4. Reset picture will remove all formatting done to the image – but the size and cropping will be left.
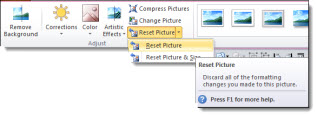
5. Reset Picture and Size will remove all formatting, cropping, and sizing and revert the image back to the original.
– Troy @ TLC
Zebra on Wheel’s Add-in Review
The Zebra on Wheel’s Toolbar add-in is available for free for PPT 2007 and above.

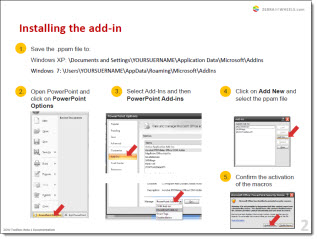
When you download, you get a zipped folder with the add-in as well as a PDF that explains which folder on your computer to put it, and what to do in PowerPoint to add the add-in to your ribbon. Note: To download, you need to give your name, e-mail address, and agree to a disclaimer.
Zebra on Wheel’s adds a new Toolbar to the ribbon:
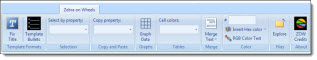
Tools added are:
Fix Title: Resets the title of the current slide to the template’s default position.
Template Bullets: Applies the template’s bullets to an existing text.
Select by Property: Selects objects using the same color, font and other properties.
Copy Property: Copy height, width, position, fill color, etc. from one object to others.
Graph Data: Extracts data table from unlinked/broken graphs.
Cell Colors: Copy/pastes table cell colors.
Merge Text: Merges the text content from different objects.
Hex Color: Uses web-style hex colors.
Explore: Opens the folder containing the current file in a Windows Explorer window.
Examples of some tools in use:
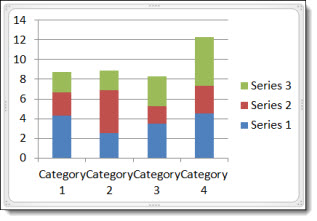
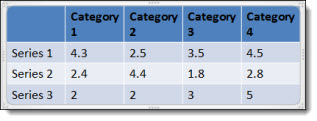
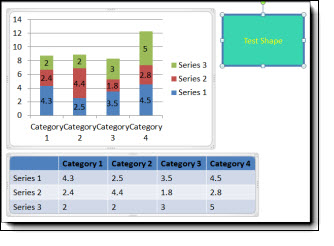
Graph Data: This add-in will pull data from charts and put it into a table. The description says it will work on unlinked and broken graphs, which could really come in handy! However, when I tried it on a broken graph an error popped up and no table was created. I inserted a new graph with the default values and the add-in produced a table with the data extracted. This is nice, but would have been nicer to have the data pulled from broken graphs as stated.
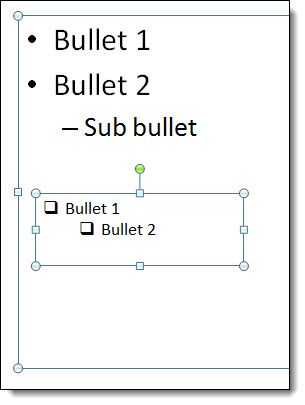
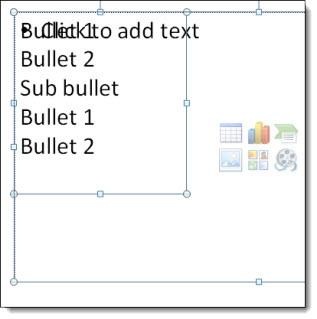
Merge Text: This add-in will take two text boxes and merge them into a single text box. I used the content placeholder and an inserted text box and hit the merge text add-in. It took the text and put them in a text box that wasn’t the placeholder, and completely disregarded the bullets and sub-bullets that were in place. (I tried merging by having the content placeholder selected first and the text box selected first, both yielded the same results. I would like this better if the bullets stayed intact.
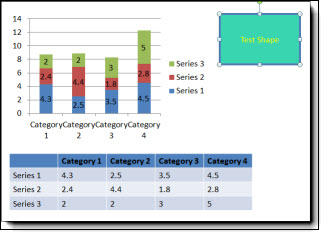
Select by Property: This one is pretty cool and works as expected. I created a test shape on the slide with my chart and table. The only thing they had in common was the font. I selected my test shape and did select by line color, nothing happened as I thought. Then I selected by font name and all three objects on the slide were selected. This particular tools is very nice and has lots of time saving use.
– Amber @ TLC
Auto Scaling Charts and Font Issues
Sometimes features go missing in newer versions of software. In PowerPoint, the “AUTO SCALE” feature for chart text disappeared after PPT 2003.
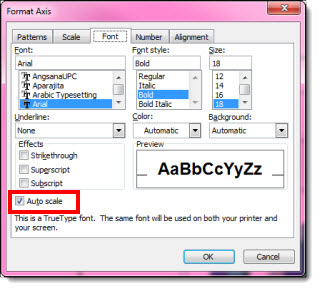
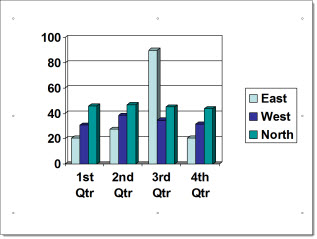
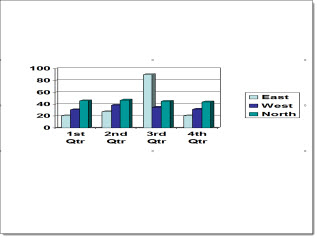
Charts in PPT 2003 have an Auto Scale font feature for chart axis’ (checked on by default) that allows the font to scale to the chart when the chart is resized.
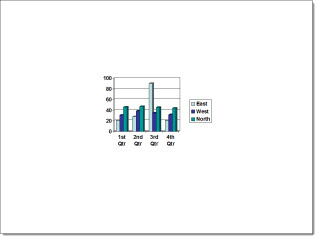
The font stays in scale to the chart when the chart is enlarged or reduced in size.
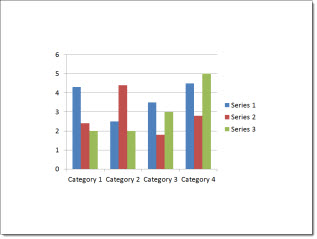
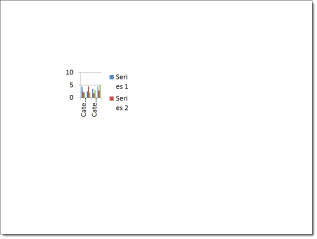
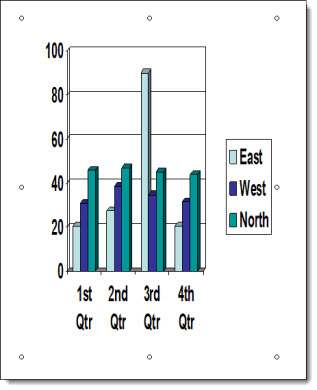
Charts in PPT 2010 do not have the auto scale font feature. When the charts are resized, the fonts stay the same size and get cut off or removed. You have to select the axis and increase or decrease the font manually.
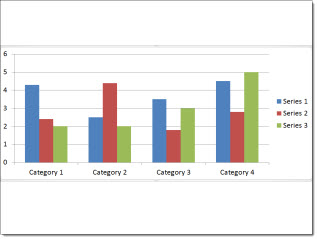
In PPT 2003, however, when the lock aspect ratio for the chart is turned off, and the chart is stretched, the chart becomes distorted.
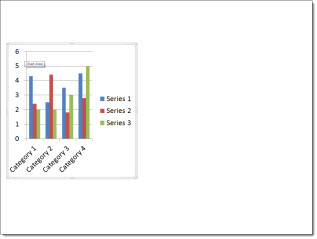
But in PPT 2010, when the charts are stretched horizontally or vertically, they do not distort.
AUTO SCALE, we miss you!
– Troy @ TLC