
Combining Static Images with Videos in PowerPoint
The design team is thinking of cooler weather (it is summer in Southern California right now, so warm – okay, hot). This a nice slide design demonstrating creative combining of static images with videos all in PowerPoint for dynamic slide design concept.
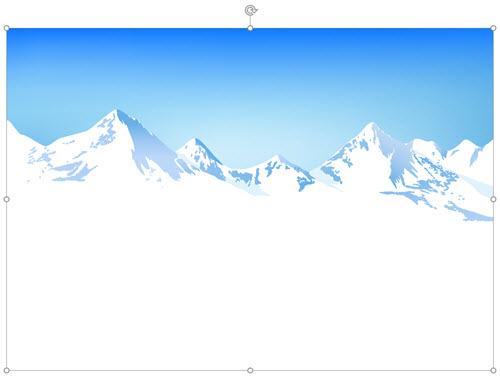
Here is the .jpg image for this example.
Here is the .mp4 video for this example. Note: the bottom grass area is not going to be seen, or a factor in deciding with video. We are only interested in the moving clouds at the top.

In PowerPoint, the blue sky above the mountain range was removed using the Remove Background tool.

The video was then added and positioned under the mountain image (see, the grass area at the bottom of the video is not see).
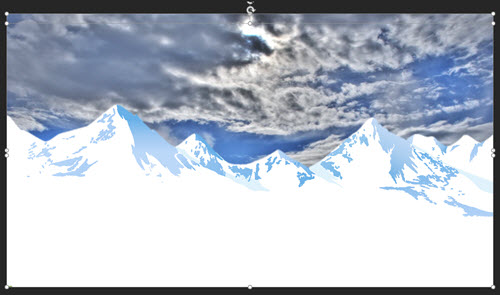
Some PowerPoint text was added and here is the final composited slide!

Troy @ TLC
Google Slide Presentations by TLC Creative
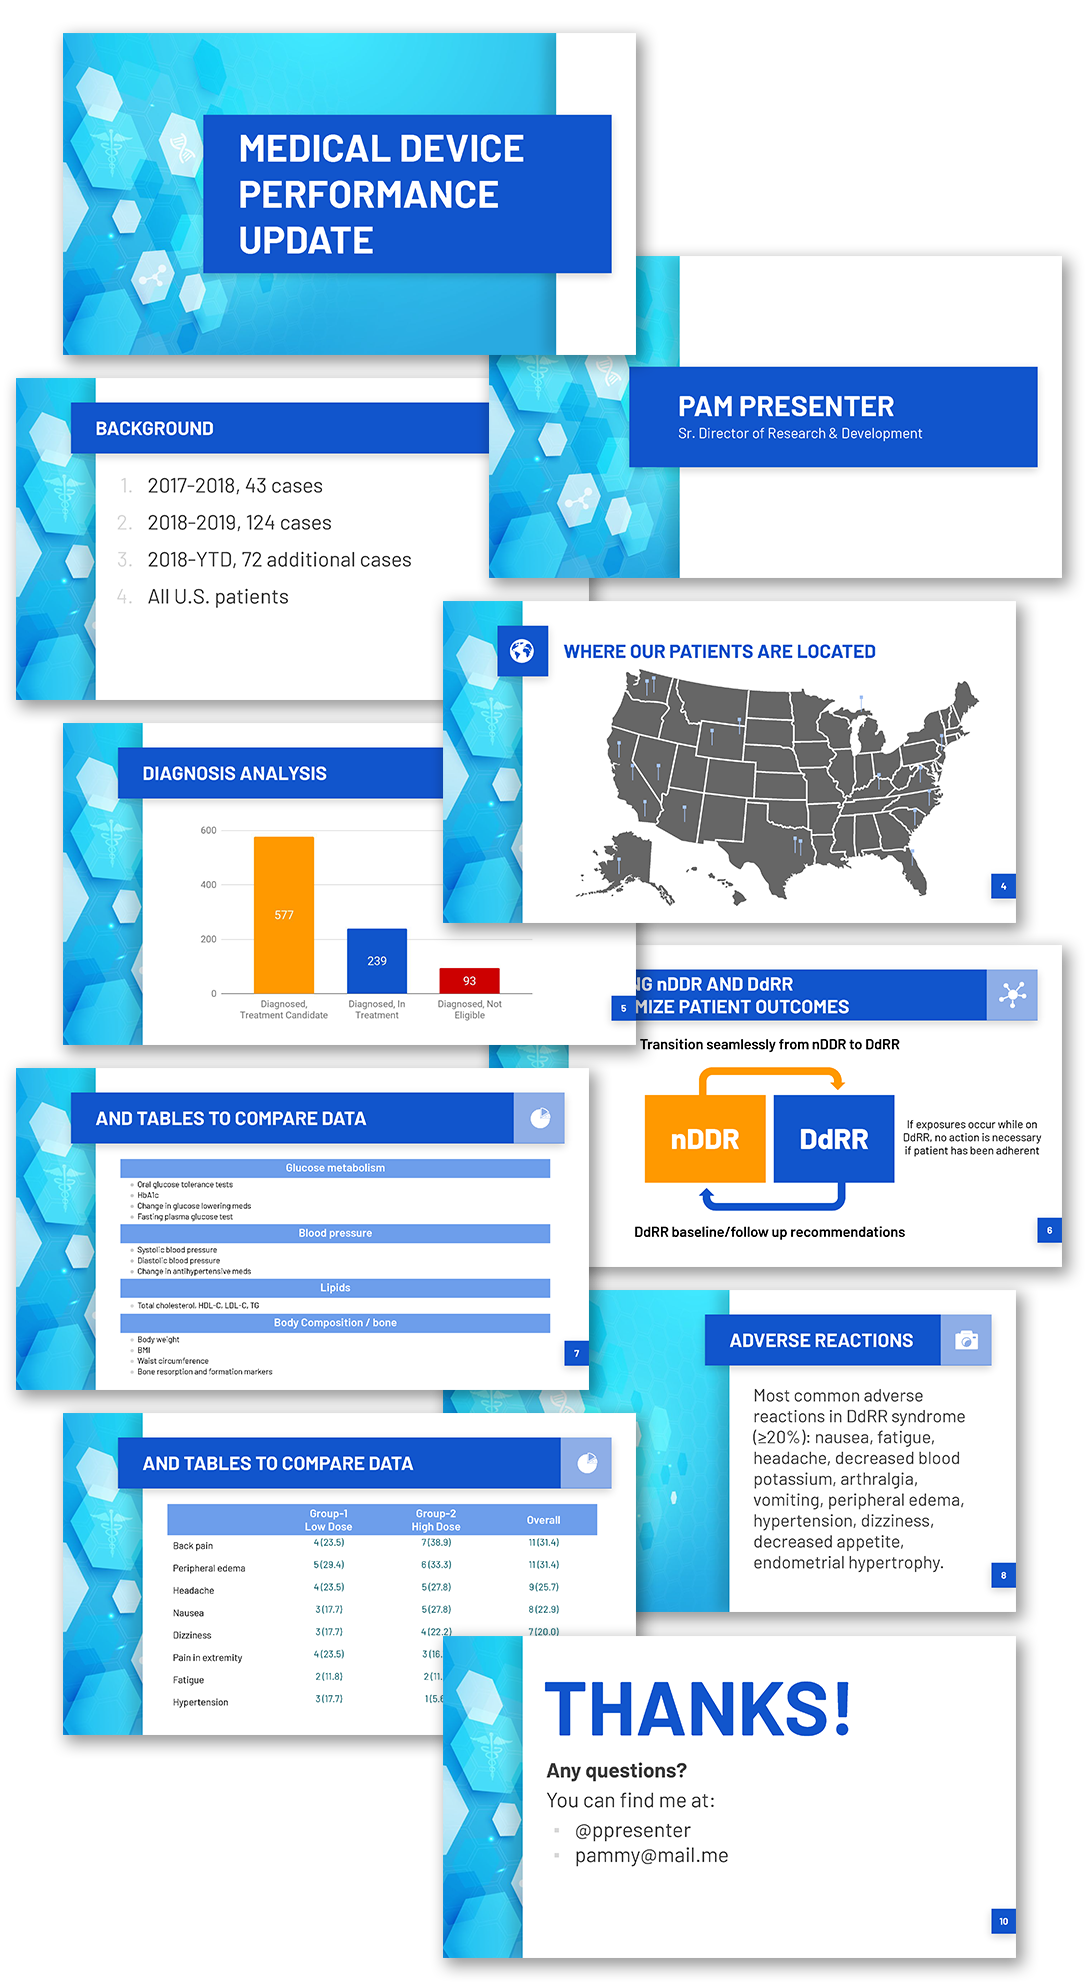
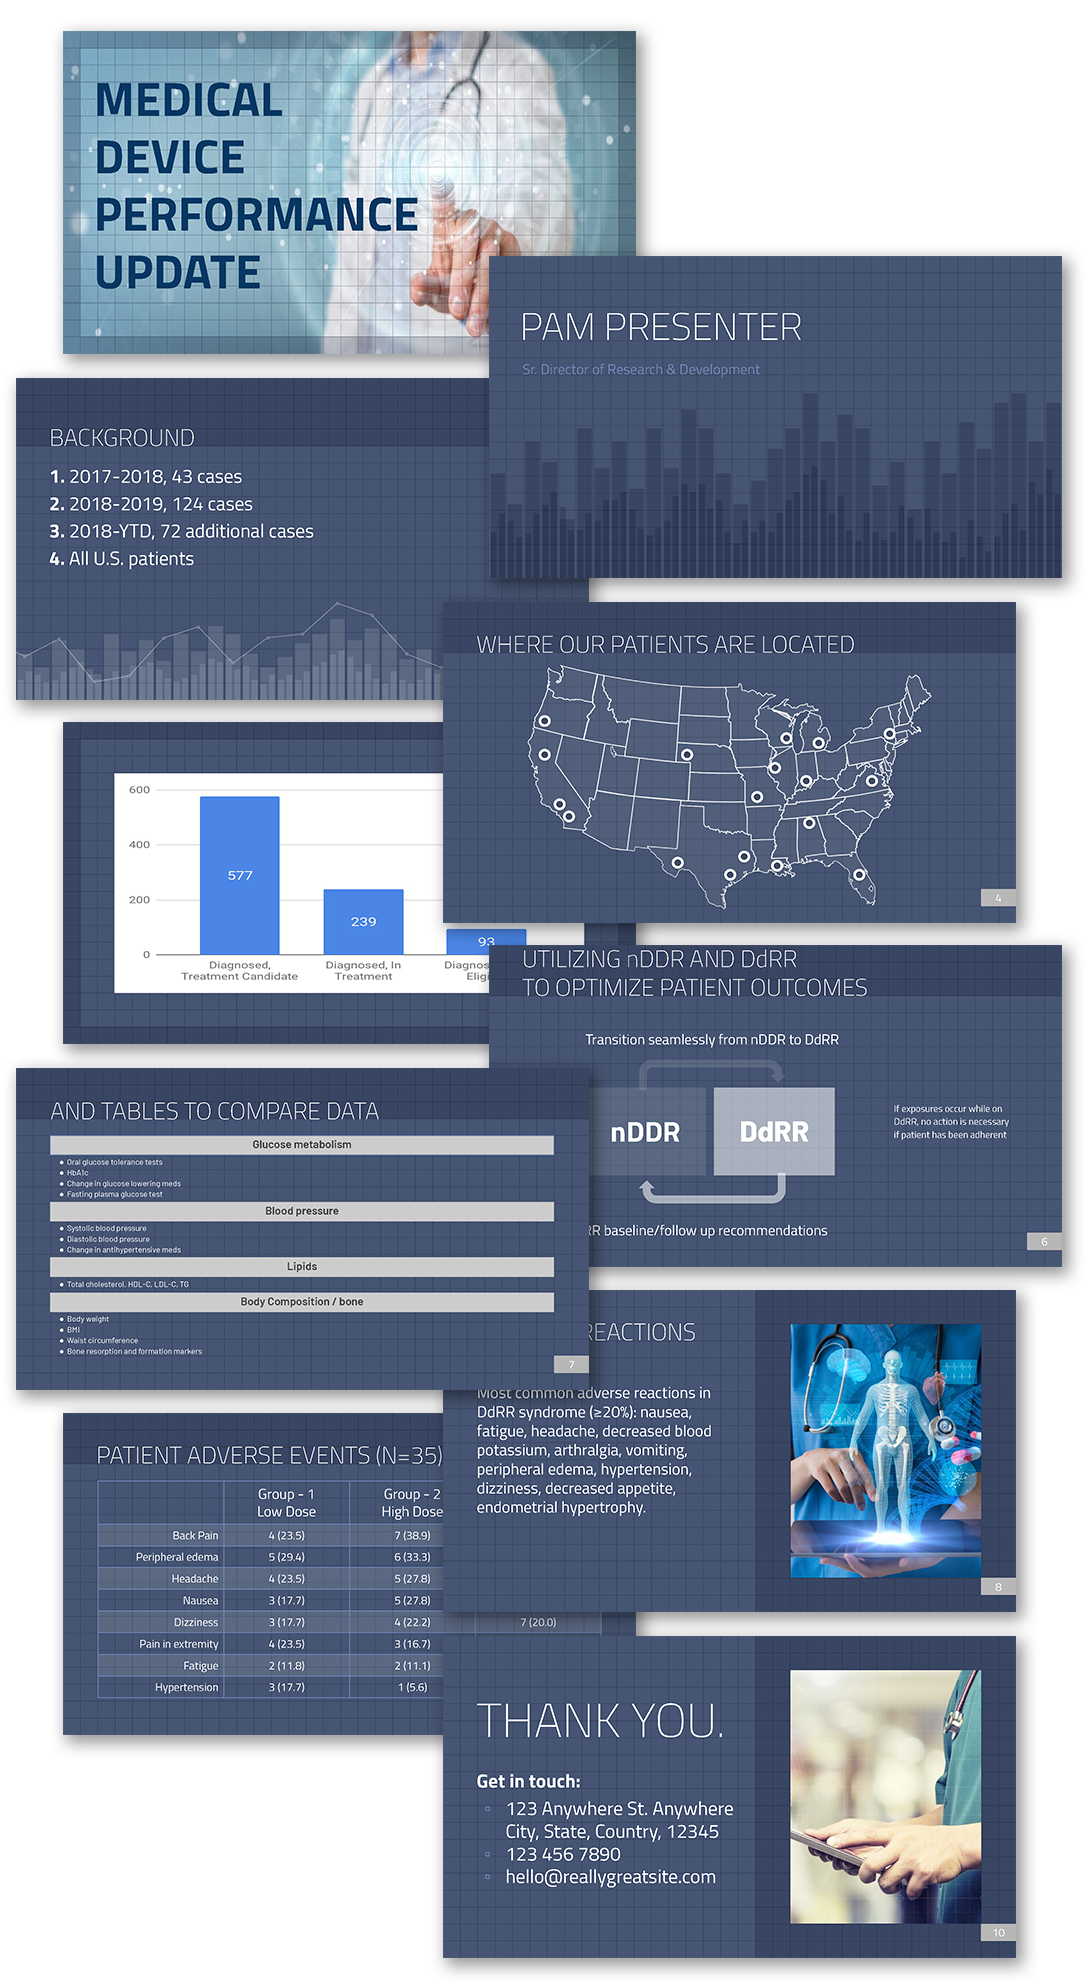
We’ve been taking a deep dive into Google Slides with this blog post series. What better way to wrap up than highlighting some of the Google Slide presentations the TLC Creative design team created. Everyone had the same presentation outline and freedom to develop the presentation in any layout and styling direction.
Amber:
Christie:

Jake:

Sara:
New Episode on The Presentation Podcast!
A new episode of The Presentation Podcast is available today! Troy, Sandy and Nolan share their lists of presentation designer resources; books/magazines, conferences, forums, online resources, podcasts, training, and information channels.
Listen on Apple Podcasts, Stitcher, Google Play, Spotify and Soundcloud – or search The Presentation Podcast for “Presentation Live is Here!” or go direct to the episode page here: https://thepresentationpodcast.com/podcast/106
Presenting with Google Slides
Presenting with Google slides is clean and easy process. In the upper right corner click the PRESENT button.
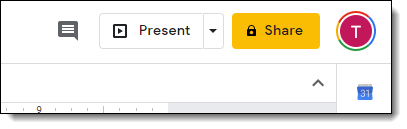
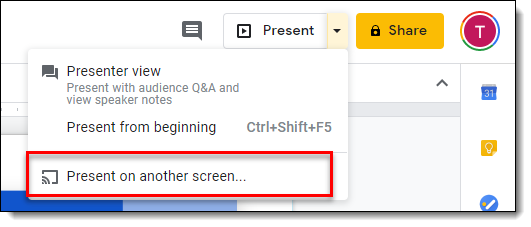
A direct click on the button puts the presentation in full screen slide show (and there is an app to turn a cell phone into a remote for Google Slides!). Click the drop down menu and a few additional options are available; PRESENT FROM BEGINNING (eg. slide #1), PRESENT ON ANOTHER SCREEN (more on this below), and PRESENTER VIEW!
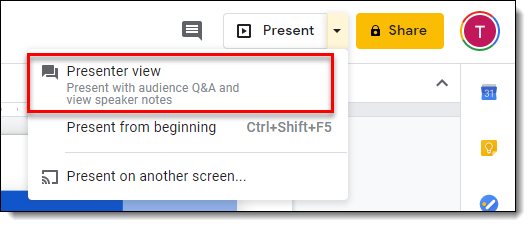
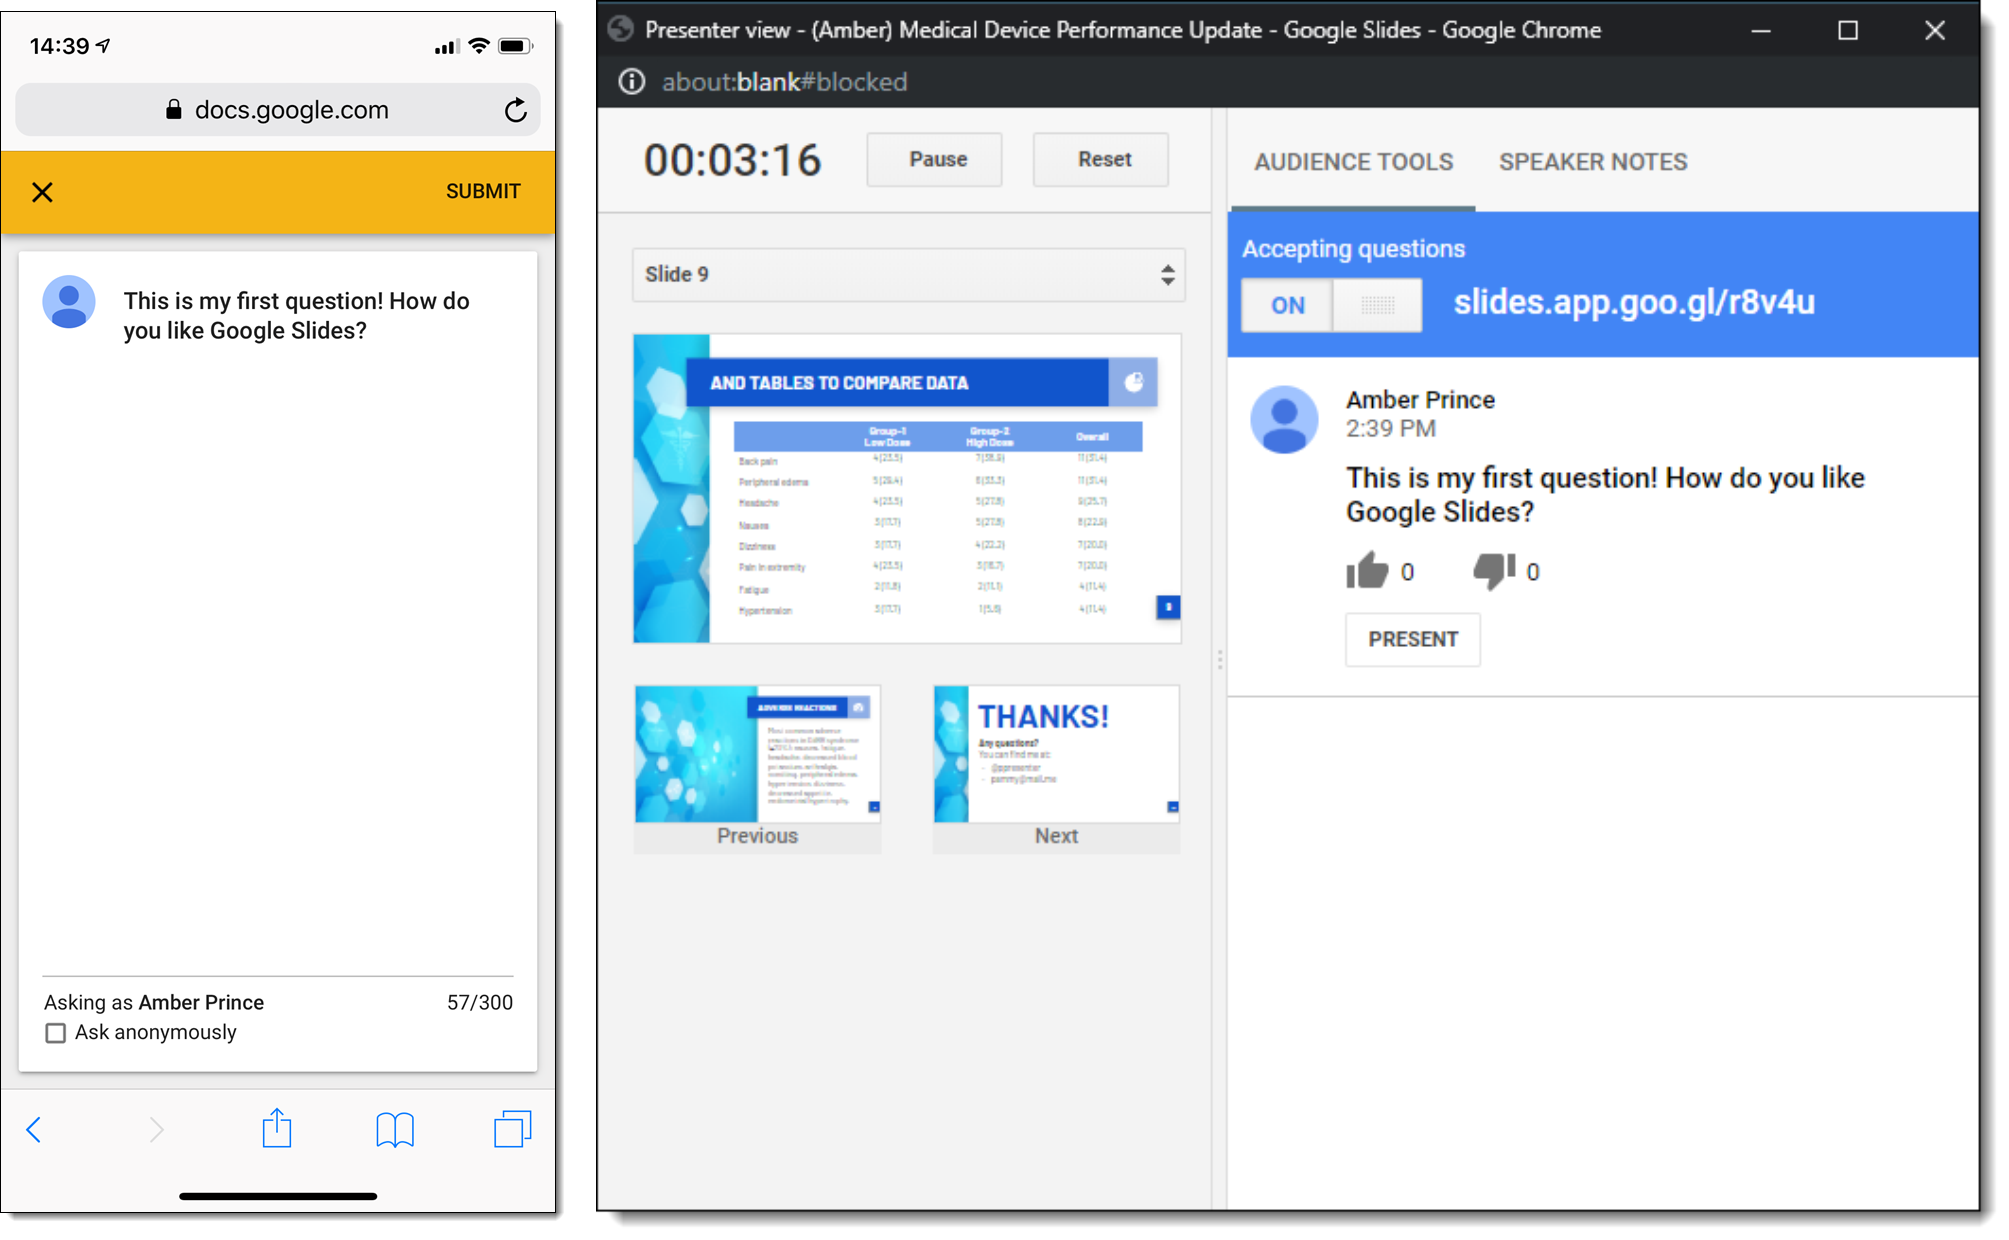
Yes, a web based app that can leverage a multiple monitors, and it does is very well! PRESENTER VIEW opens in a new window and shows the previous, current and next slides. There is a timer, an Audience Q&A feature and SPEAKER NOTES (that can be formatted with styling) There is also a drop down menu to jump to any slide in the presentation easily (but like PowerPoint, jumping to a slide in a non-linear order does not respect the applied transition effect).
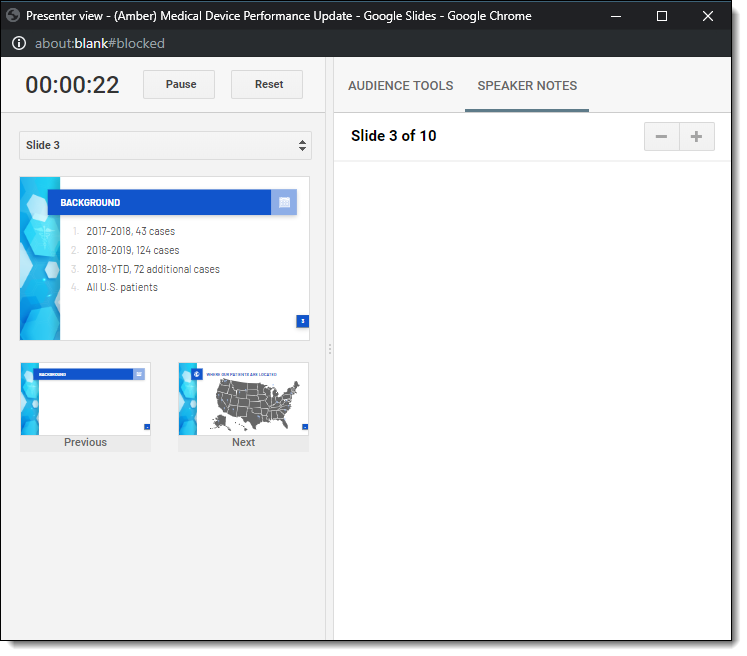
In the AUDIENCE TOOLS is the polling feature. It assumes everyone watching is on a device, and not watching the presentation on a large event screen. What I was really impressed with is how the audience polling integrated into the Presenter View interface (Microsoft – take note!).
The PRESENT ON ANOTHER SCREEN is a clean interface to a ChromeCast enabled monitor (I can easily see this as a corporate event option of the presenter connecting to a ChromeCast that is inline with the show equipment, enabling a presenter to run their presentation from stage and roam). I also was excited about the thought of having Presenter View on a phone or tablet and the presentation on a wireless screen – but that is not an option…
There is a way to use Google Slides offline, but the safest approach is to plan to be online while presenting. The presenting experience is clean, easy to use and if using Presenter View, very robust.
Troy @ TLC
Google Slides Export Options
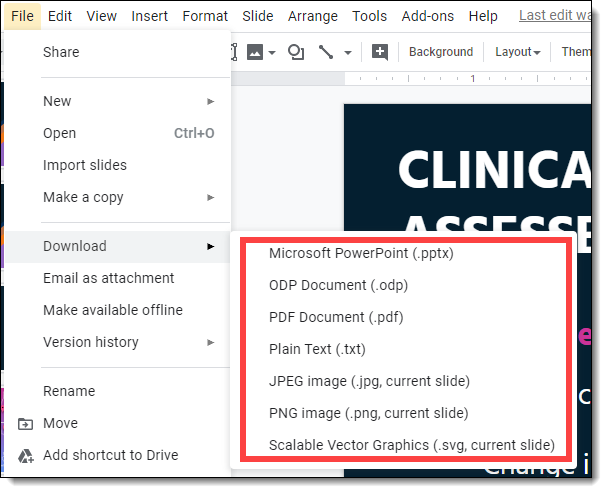
Google Slides has the ability to easily convert your Slides Project into a variety of file types. The export options are PDF, SVG, PNG, TXT, ODP, JPEG and full PowerPoint PPTX.
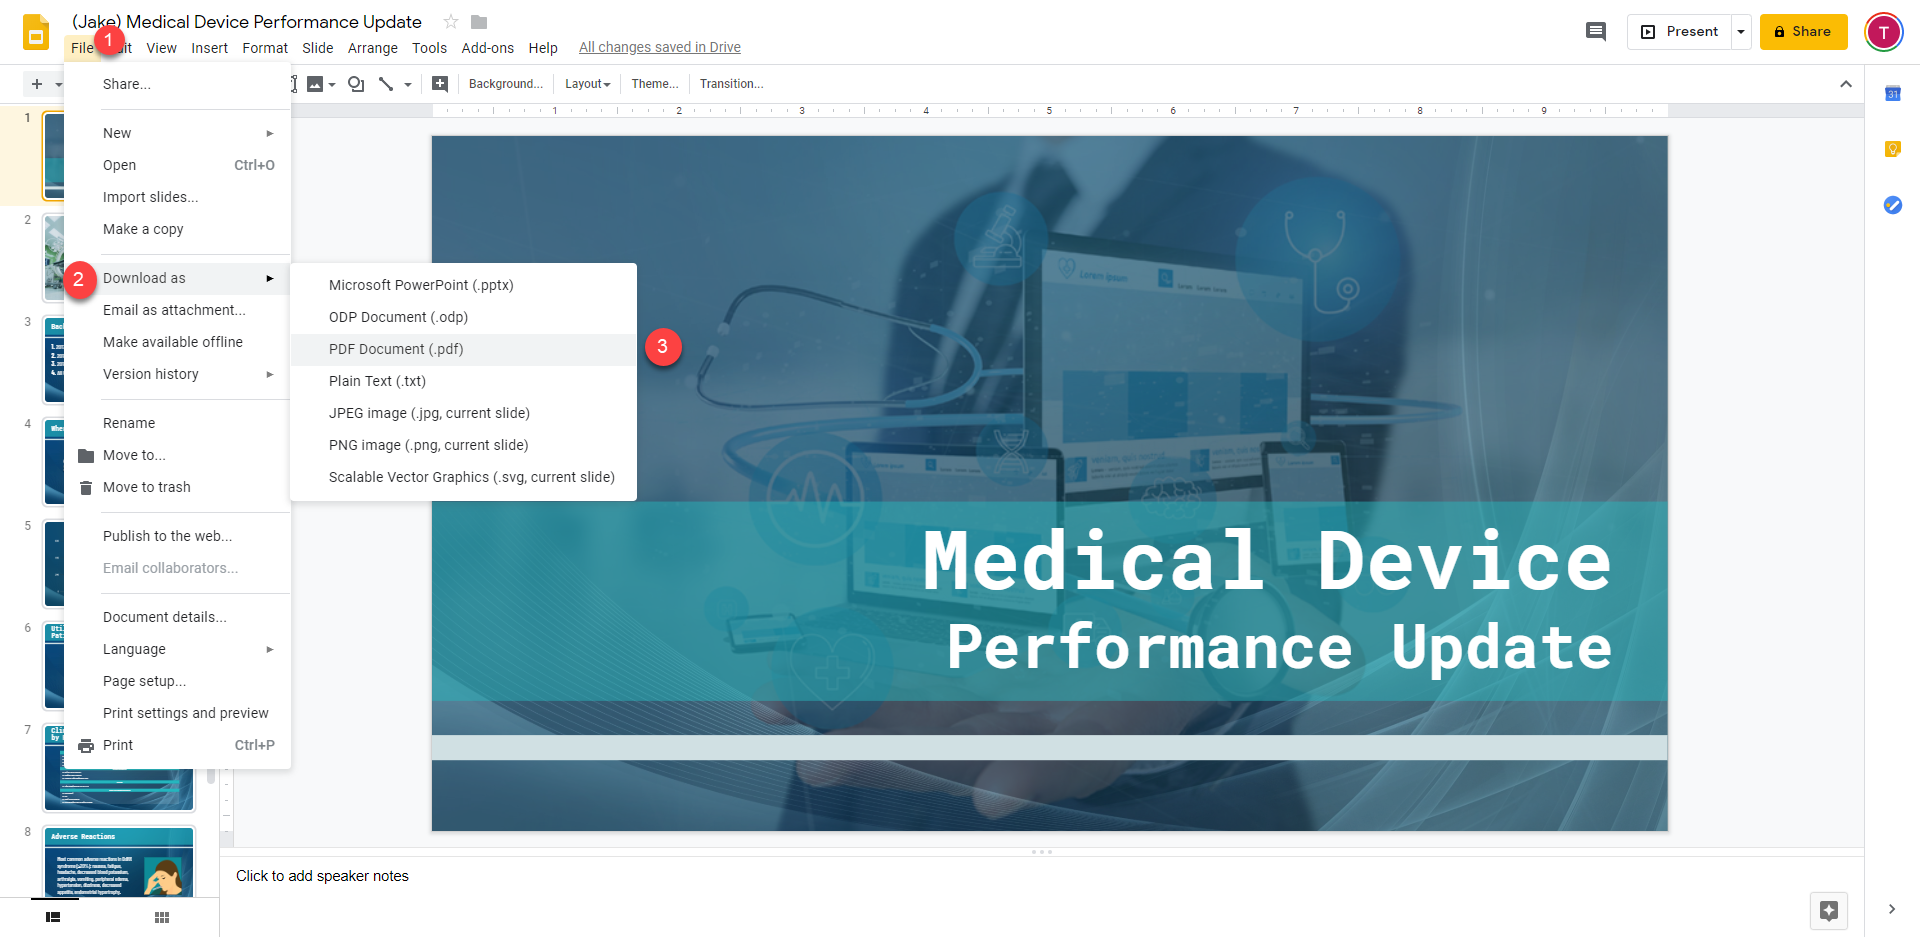
To export your Slides presentation:
- At the top menu bar, click File
- Select Download as
- Select the file type you would like to export to
The image quality is good, but does not offer the ability to set the exported image size. PDF files render all the visual effects in out creations just fine. The Plain Text output is an interesting option, and while traditional bullet list text heavy slides would work well, it does produce a text document of head scratching puzzlement if it is a visual slide deck with multiple callout text boxes that really are not made to make sense in a word only format. SVG output produced very usable files (and this is a recent addition to PowerPoint too), for me it was primarily a way to get vector graphics into Illustrator or After Effects for use in coordinated design elements (eg. presentation and speaker title intro sizzle video). Last, the ability to export to .pptx is not only the first option in the export list (which is another question – how is the export options list organized? It is not alphabetical, it is not by rank of use, what is it organized by?), but it clearly says PowerPoint is the top of the presentation world and other applications need to play nice with it (PowerPoint offers an export to ODP, which is exactly in the SAVE AS menu not the Export menu, but no .slide or any other application native file type).
Troy @ TLC
Google Slides – the Good, the Bad, and the Missing
Google Slides is a popular presenting tool, for good reason and among online only apps, it is the the top of the offering. Last October the TLC Creative design team spent some time as a group diving into Google slides as an internal project (yes, we do Google Slides projects!). After our 2 weeks of intensive Google Slides use we gathered everyone’s feedback and created a number of best practices guidelines for projects. I recently revisited those results and put together our list of how Google Slides compares to PowerPoint and other presentation programs like Canva and Keynote.
As with most applications, Google Slides easy to quickly get started using and seems simple on the surface. We discovered it has a number of surprisingly complex features. And, we discovered there are some areas where it just does not compete with are main benchmark, PowerPoint.
The big question to ask is – how do you know if Google Slides is right for your presentation?

There are plenty of great features included in Google Slides. Perhaps the most obvious advantages include its collaboration functionality – multiple people can work on the same presentation at the same time, and it’s easy to track revisions that were made (and who made them and when – and you can restore to an old version if needed). It’s online platform does a great job of showing who is editing a file and shows revisions in real time with highlighted boxes.
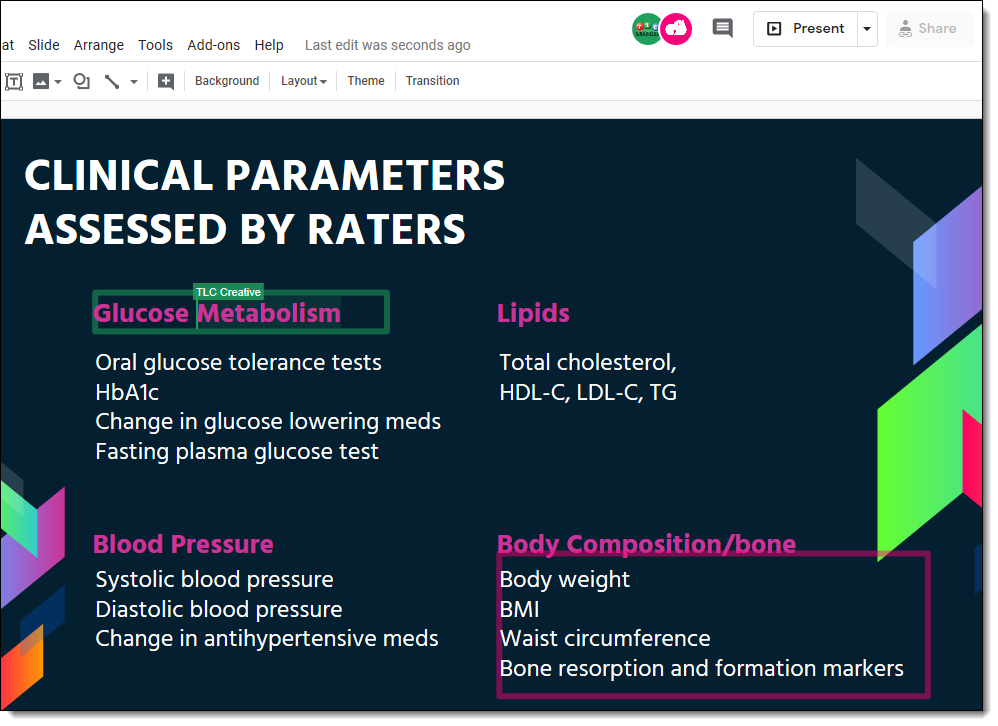
Of course, as a Google product, Google Slides (“Slides”) functions seamlessly with other Google apps, such as Sheets and Drive. Plus, for the shortcut users, it has the familiar short keys that designers will be familiar with from Adobe products, including CTRL-D for duplicate, holding ALT to resize from center, and more.
The real question is how does it stack up compared to other presentation platforms? We love that, unlike Canva, Google Slides allows you to insert actual tables, and it has additional export options such as JPG, PNG, and SVG. Google Slides has the ability to apply animation effects – and animate elements separately (a common feature in PowerPoint, but something not possible in Canva). On the export options, it has an export to PDF or PowerPoint…
Google Slides does have a Slide Master structure. It is not as robust as a properly setup PowerPoint template, but it does update graphics and placeholders that appear on all slides. It also cooperates with a number of useful add-ons, such as Vizzlo charts, which bypasses the need to learn Google Sheets to make charts for your presentation.

Google Slides comes with its limitations. In trying to create a simple to use workspace, Google Slides inadvertently makes some things more difficult and more unintuitive than we feel is necessary. It does have a color scheme feature, but it is difficult to create a custom theme (something we implement on every PowerPoint template). There are a few pre-made color schemes, but they feel too “default” and overused (same thing for PowerPoint, we never settle for the provided color schemes).
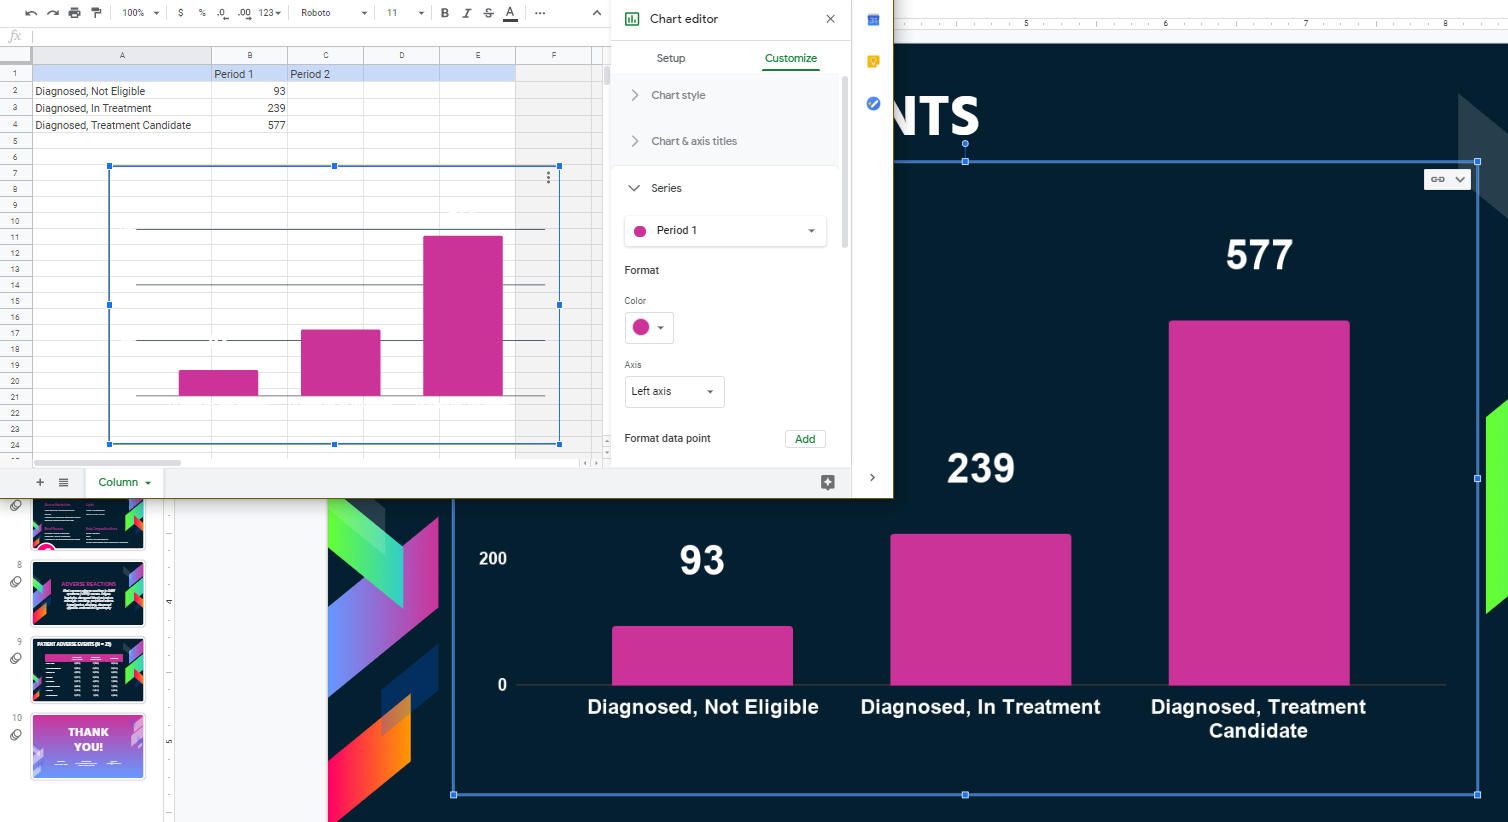
Another problem area is charts. The only way to edit a chart is with Google Sheets, which is essentially Excel Light. In order to figure out how to build a chart in Sheets, you must already know real Excel (hey, we have a team of visual designers, Excel is not our thing – hence PowerPoint’s simplified excel feature set directly in PowerPoint is appreciated!). After a chart is created, the simple act of updating the data, colors, or fonts involves another trip into Sheets, which also means we are not seeing how the visual styling looks on the slide until we import the updated chart. And a grumble among everyone on our team was charts are difficult to resize. They appear stretched if you resize it inside of Slides, meaning yet another trip to Sheets, then refresh the link in Slides to see if the simple resize is what was needed. One of the tips we have is to work with a dual monitor setup; Google slides on one monitor, Google Sheets on the other monitor. This limits some of the back-and-forth between browser tabs just to get something seemingly simple like resizing or recoloring accomplished.
Other items on our “the BAD” list include no “reset” button to snap everything back into its master layout defined position and formatting (note: if you right click and use “Apply Layout” things basically start over). Inserting a vector image creates a convert-upload-convert-insert-convert ordeal. Google Slides does handle some file formatting PowerPoint does not, if you can deal with the process of getting them onto the slide (we still prefer PowerPoint’s drag-n-drop or copy-paste simplicity of adding graphic elements to slides).
Even some of the cool features that are impressive, make the bad list by having big limitations. As example, a PowerPoint other presentation file can be uploaded to Google Drive, then converted to a Google Slides presentation (because PowerPoint and Adobe PDF do not have options to export a Google Slides format document). But there is an unfortunate 100 MB size limit for that conversion, which as presentation designers just isn’t realistic. There is a handy “Search the Web” for images feature (Insert > Image > Search the Web), but the usable results are generally pretty limited, and there is no visible attribution information, which is important to us (and our clients) as these are not open source images.

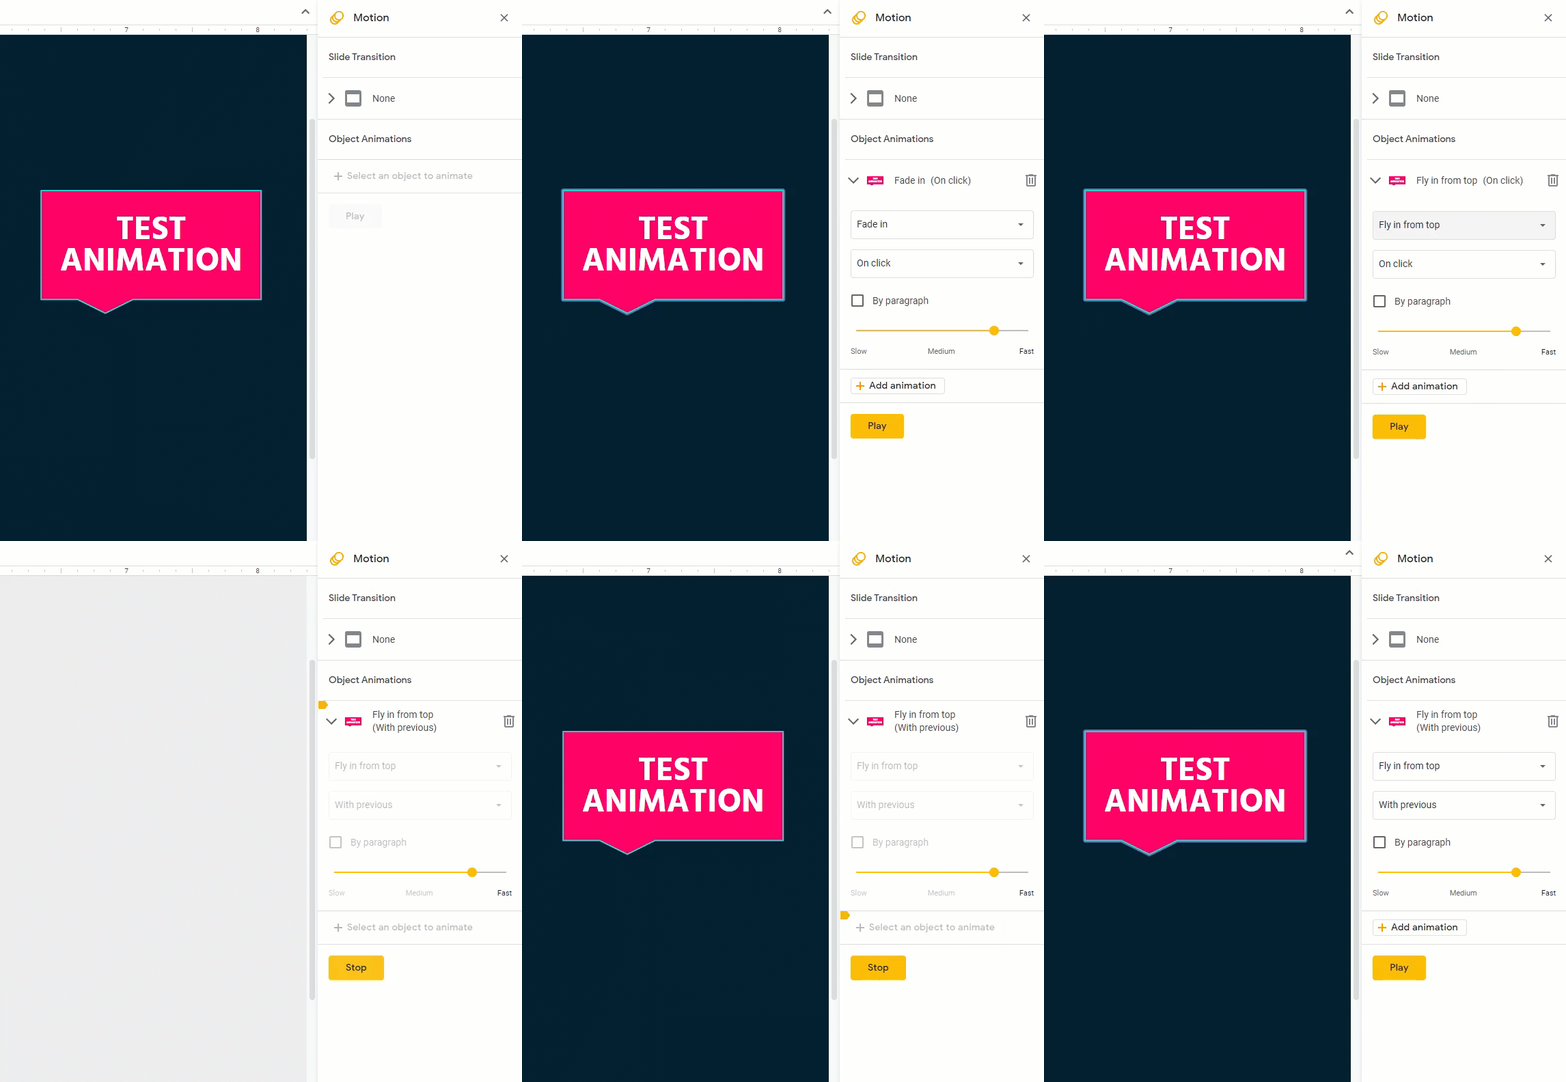
Finally, there are the features and tools that Google Slides just plain doesn’t have as part of its offerings. The choices for animation are limited, and they represent only a few of the basic and moderate effects found in PowerPoint and Keynote. Things like customizing the animation effect, such as its speed, is there, but with a drag toggle interface, no number input, quick selection, or ability to apply to multiple elements at the same time – we are stuck with applying customizations to animations one by one. Slide transitions also suffer the same. There are limited options, such as “fade” (the most common transition effect in all presentation software) being a fade through black (and we felt it was a choppy fade effect).
As mentioned earlier, colors are also difficult to work with in Google Slides (and all Google products). You can add a custom color to specific elements with either a HEX value or by using Hue and transparency sliders can be done. Changing the overall presentation color scheme is trickier. There are two sets of colors: the “default” color scheme, with tints and shades like in Office products, and then below that is a single line of the presentation color scheme. You can edit the custom scheme, but if you are able to edit the default color scheme, we can’t figure out how. This is frustrating as you’re limited to the exact colors of your custom color scheme, and not the tints and shades that help create a well-designed presentation.
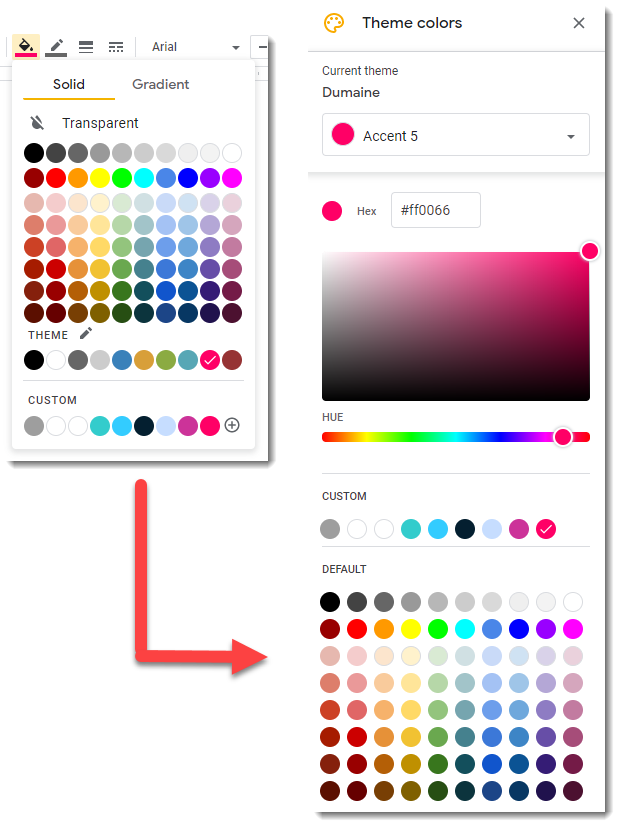
We’ve already addressed some of the issues with charts, but there are some missing features that would increase usability and customization significantly, including the ability to change the color and weight of the axes in a chart (which, again, is a limitation of Google Sheets, not Slides). You also can’t remove the axes without also removing the labels, which can pose stylistic issues.
The toolbar is generally familiar, and similar to PowerPoint’s. But not all the tools function in the same way. Perhaps most notable is the paintbrush tool; in PowerPoint the format painter “paint brush” will copy color, font, size, and position. In Slides, it will only replicate the color and font, leaving you to manually resize and shift position.

At the end of the day, Google Slides is a powerful tool for collaboration, quick and simple presentation building and editing, and integration with other Google Products. Will we at TLC Creative be replacing PowerPoint with Slides anytime soon? Definitely not. But mastering this tool and adding it to our professional services is just one more way we can work with our clients to provide the best experience possible.
What is Google Slides?

Google Slides is a web-based (aka, online) presentation design software offered by Google as part of their Google Drive service.
Presentations can be created and run as slideshows from any desktop through all major browsers, as well as mobile device support. Because it is a cloud based app, being online is a key part of use – however, Google Slides does have an offline mode when used through the Chrome browser.

Presentations can be downloaded as a PowerPoint file, PDF, or different image types (jpg, png, svg). One big feature is while being a web app, it has a Presenter View! And there is also a live audience Q&A feature.
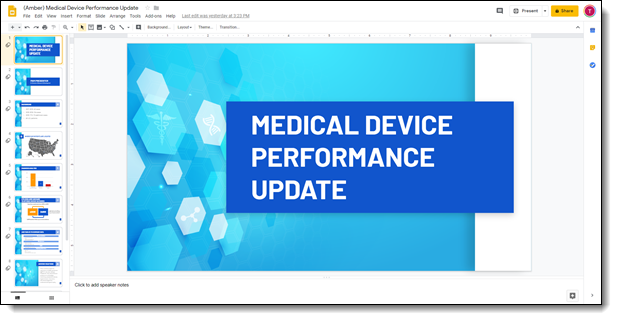
My opinion, any presentation can look amazing with the assistance of a presentation design expert. While Google Slides does not offer the breadth of features and template/master slide options of PowerPoint, it is a viable solution. I see it used primarily as a good option if for simple content presentations without a lot of flash. I am not a fan of stock templates and themes, which may be why Google Slides does not offer an abundance (26 as of June 2020). There are animation and video options. If you have a chart heavy presentation, Google Slides is a tedious process of going outside Google Slides and working through Google Sheets for all edits, revisions and formatting.
Sharing and co-authoring are super simple with seamless integration with Google Drive. And, Google Slides is free!
Troy @ TLC